Tables are a powerful way to extract structured data efficiently when you know in advance what data you need to capture.
For example, tables work well when mapping predefined variables across studies, such as measurement tools used, outcome categories reported or types of interventions described.
1. Define specific headings
In a dual-reviewer workflow, tables must be set up carefully to ensure a smooth consensus process. Even in single-reviewer workflows, clear table structure helps ensure exported data is meaningful and usable.
We recommend
Use clear, descriptive headings such as "Physical Therapy" or "Quality of Life"
Avoid generic labels like Intervention 1 or Outcome A
Avoid leaving row and column headings empty
FAQ: What if I don’t know all the headings upfront?
This is common in scoping and literature reviews. We recommend:
Adding all known headings to the table during template setup
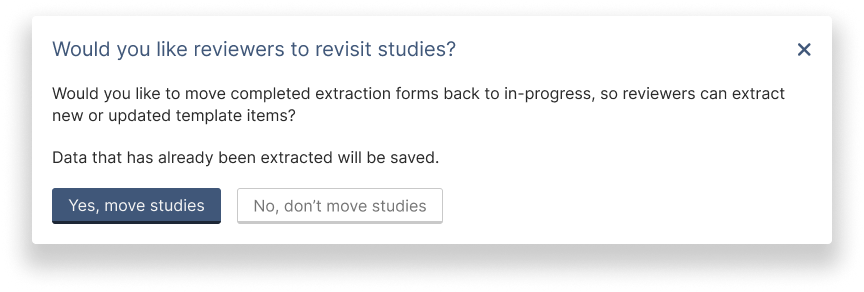
If a reviewer encounters a new heading during extraction, they can add it to the template
At that point, the reviewer can choose to:
Move completed studies back to in-progress, or
Leave existing studies unchanged if the new heading does not affect them
2. Limit number of columns
Tables should be easy to view and compare during extraction and consensus.
Things to consider
If your table needs more than 5 columns, consider splitting it into multiple tables
Large numbers of columns make it difficult to see and reconcile data effectively
A higher number of rows is generally manageable (limit of 100 rows per table)
3. Plan with export in mind
In Extraction 2, data is exported as a CSV file, with one study per row, per reviewer.
To support this format, tables are exported in a flattened structure where each cell in the table becomes a separate column in the export.
Therefore the exported format may look very different from how the table appears in the template, extraction, or consensus views - as shown in the example below:
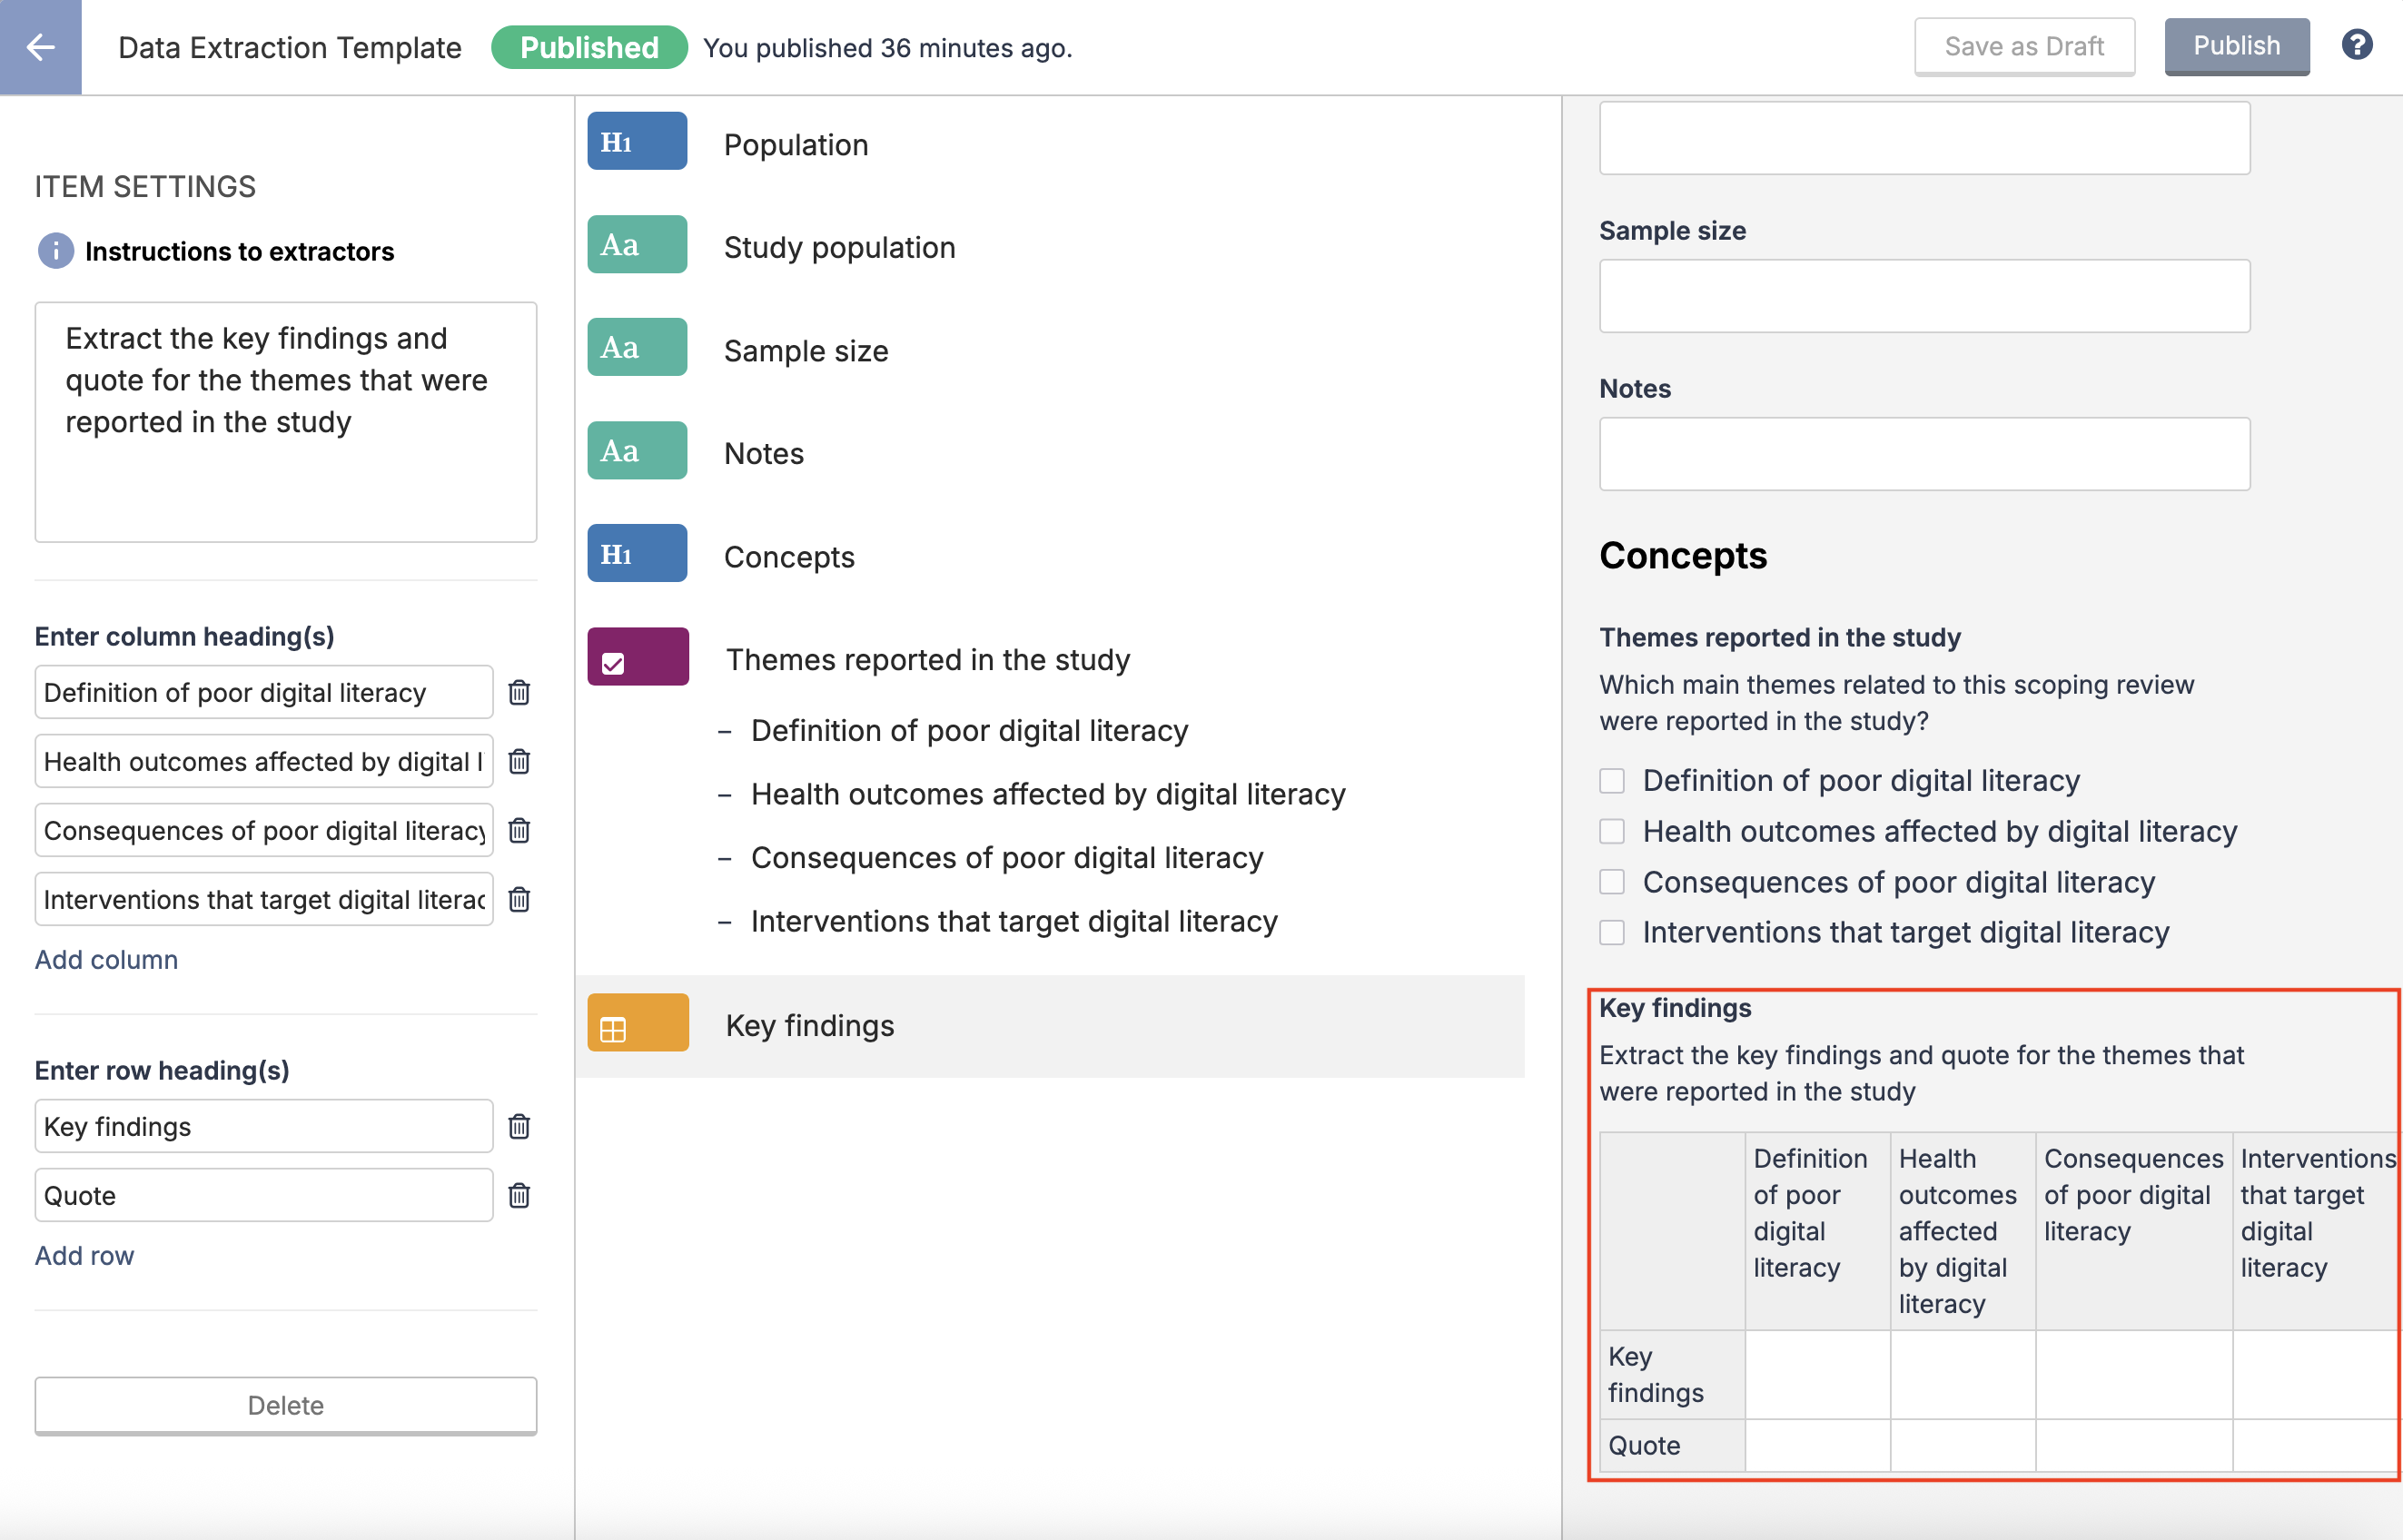
Template view
When creating the template, a table can be added with columns and rows.
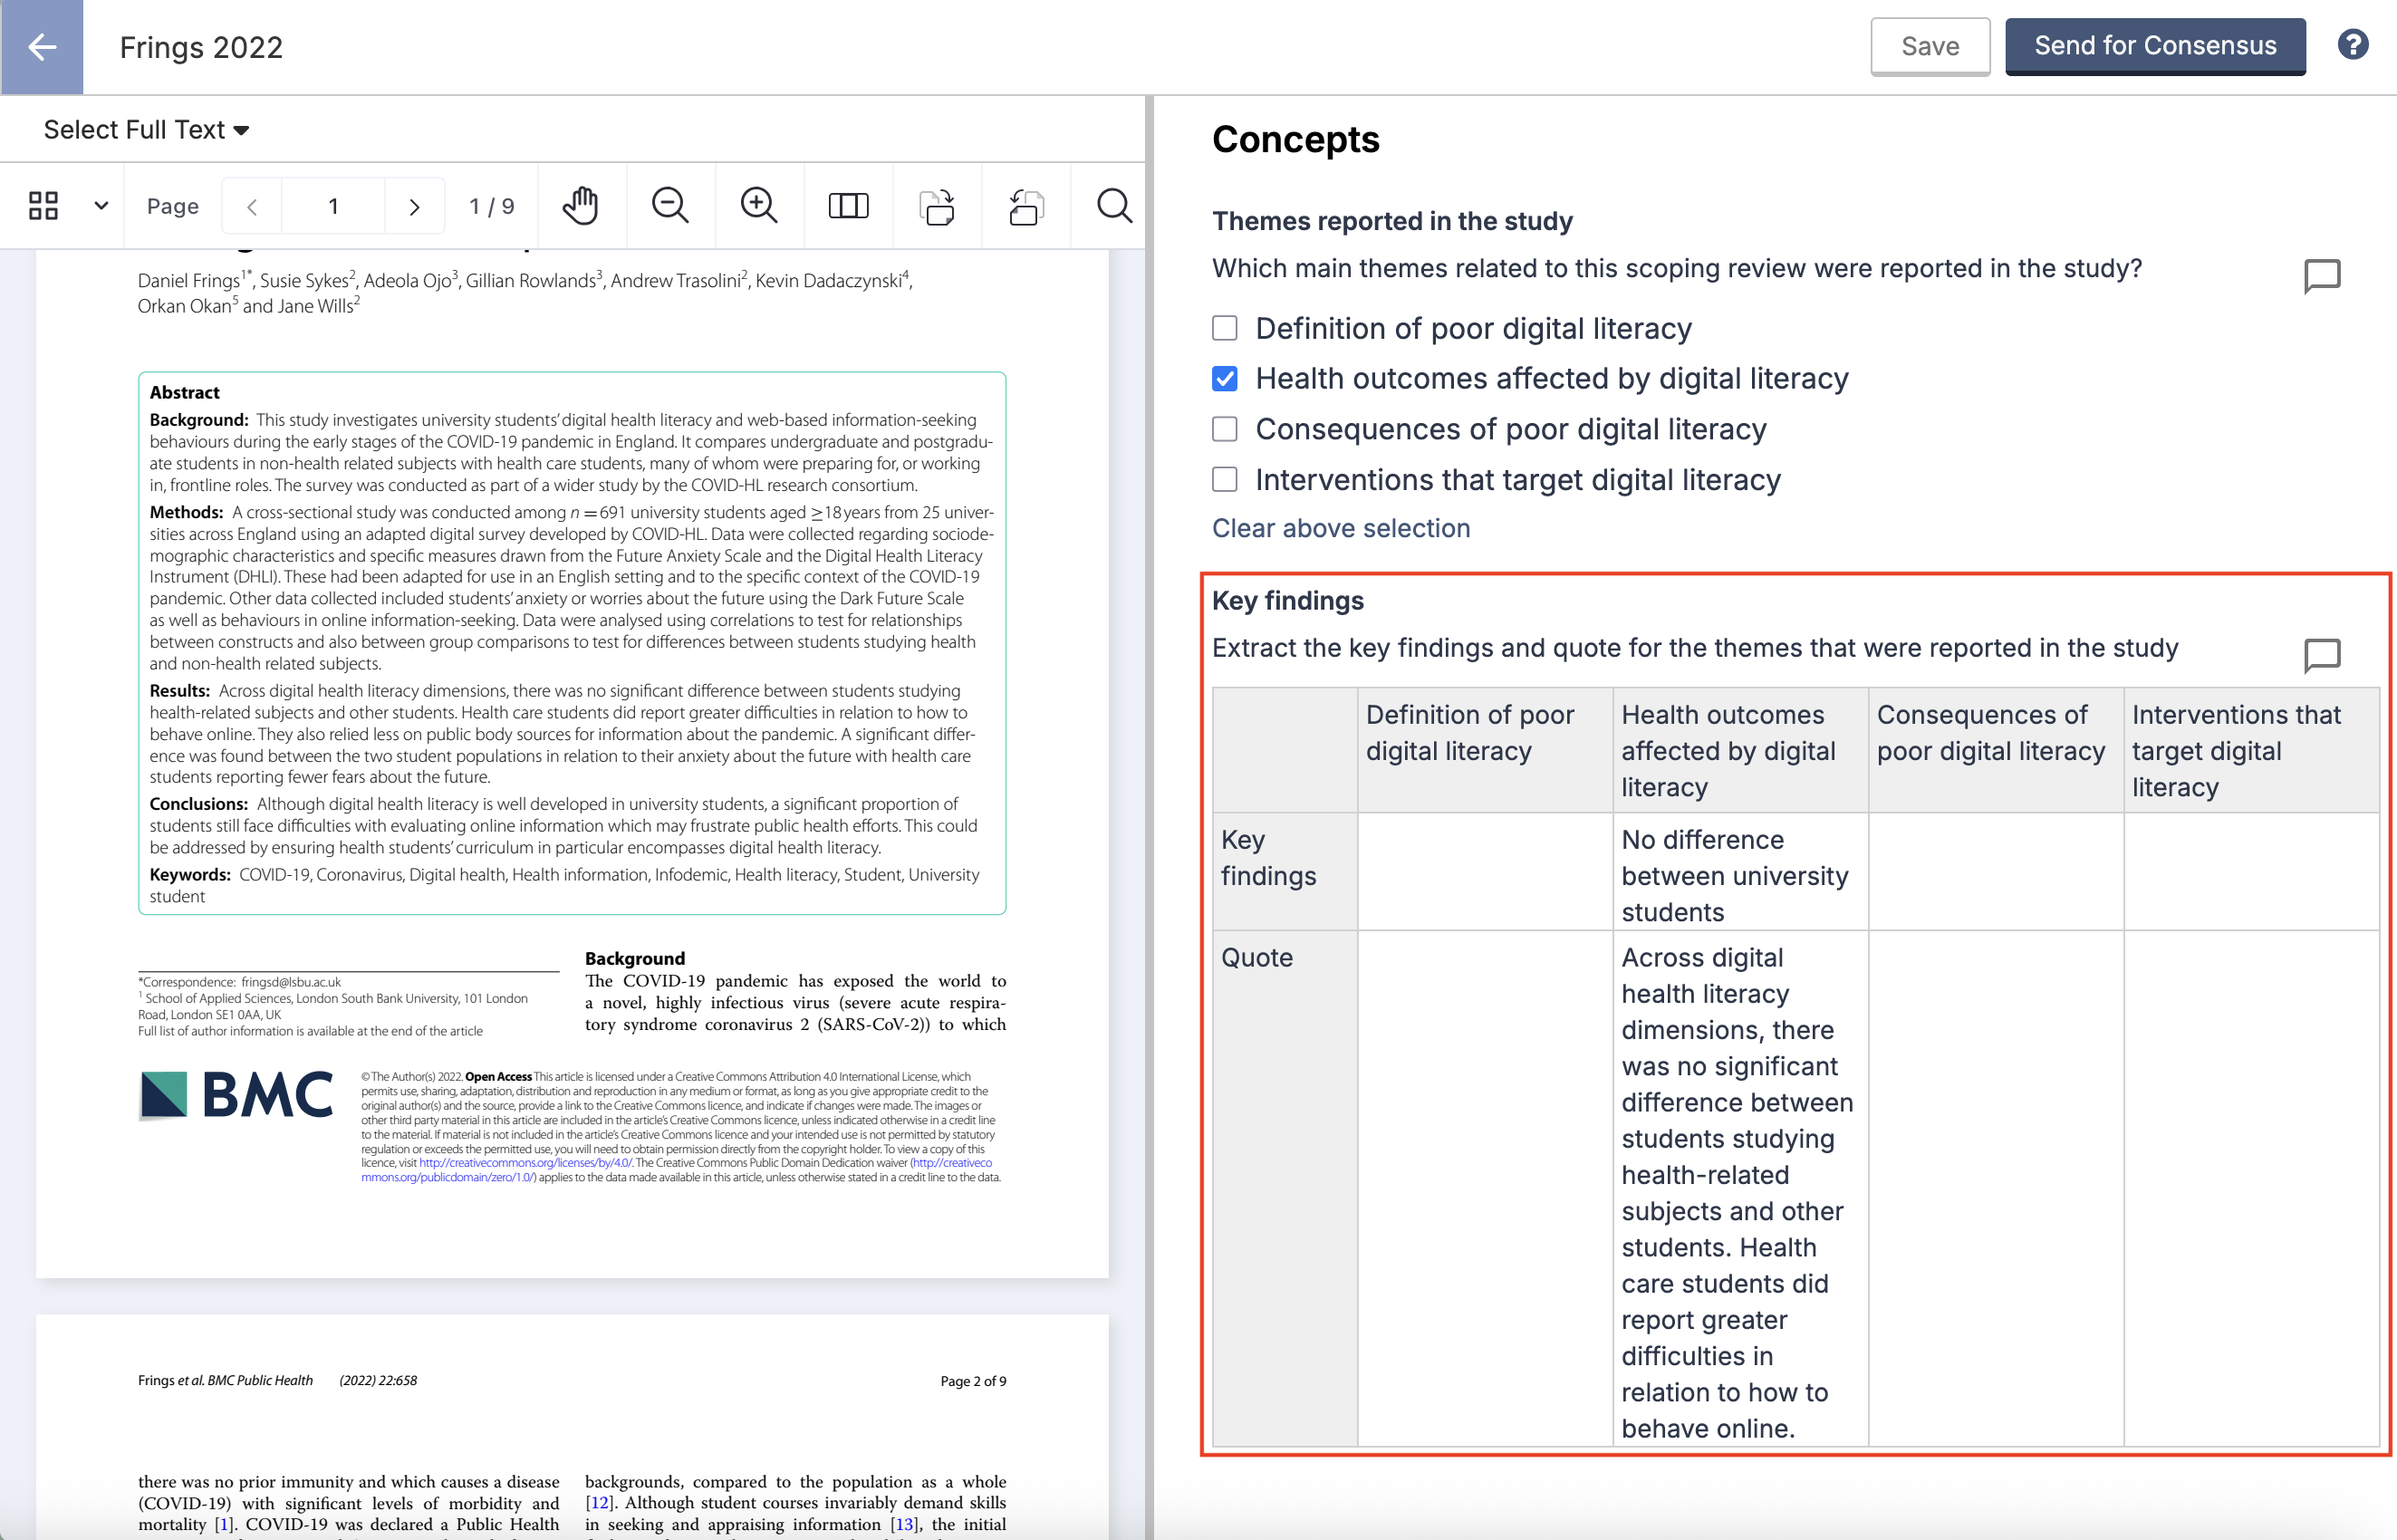
Extraction form view
During extraction, reviewer can add data to the table.
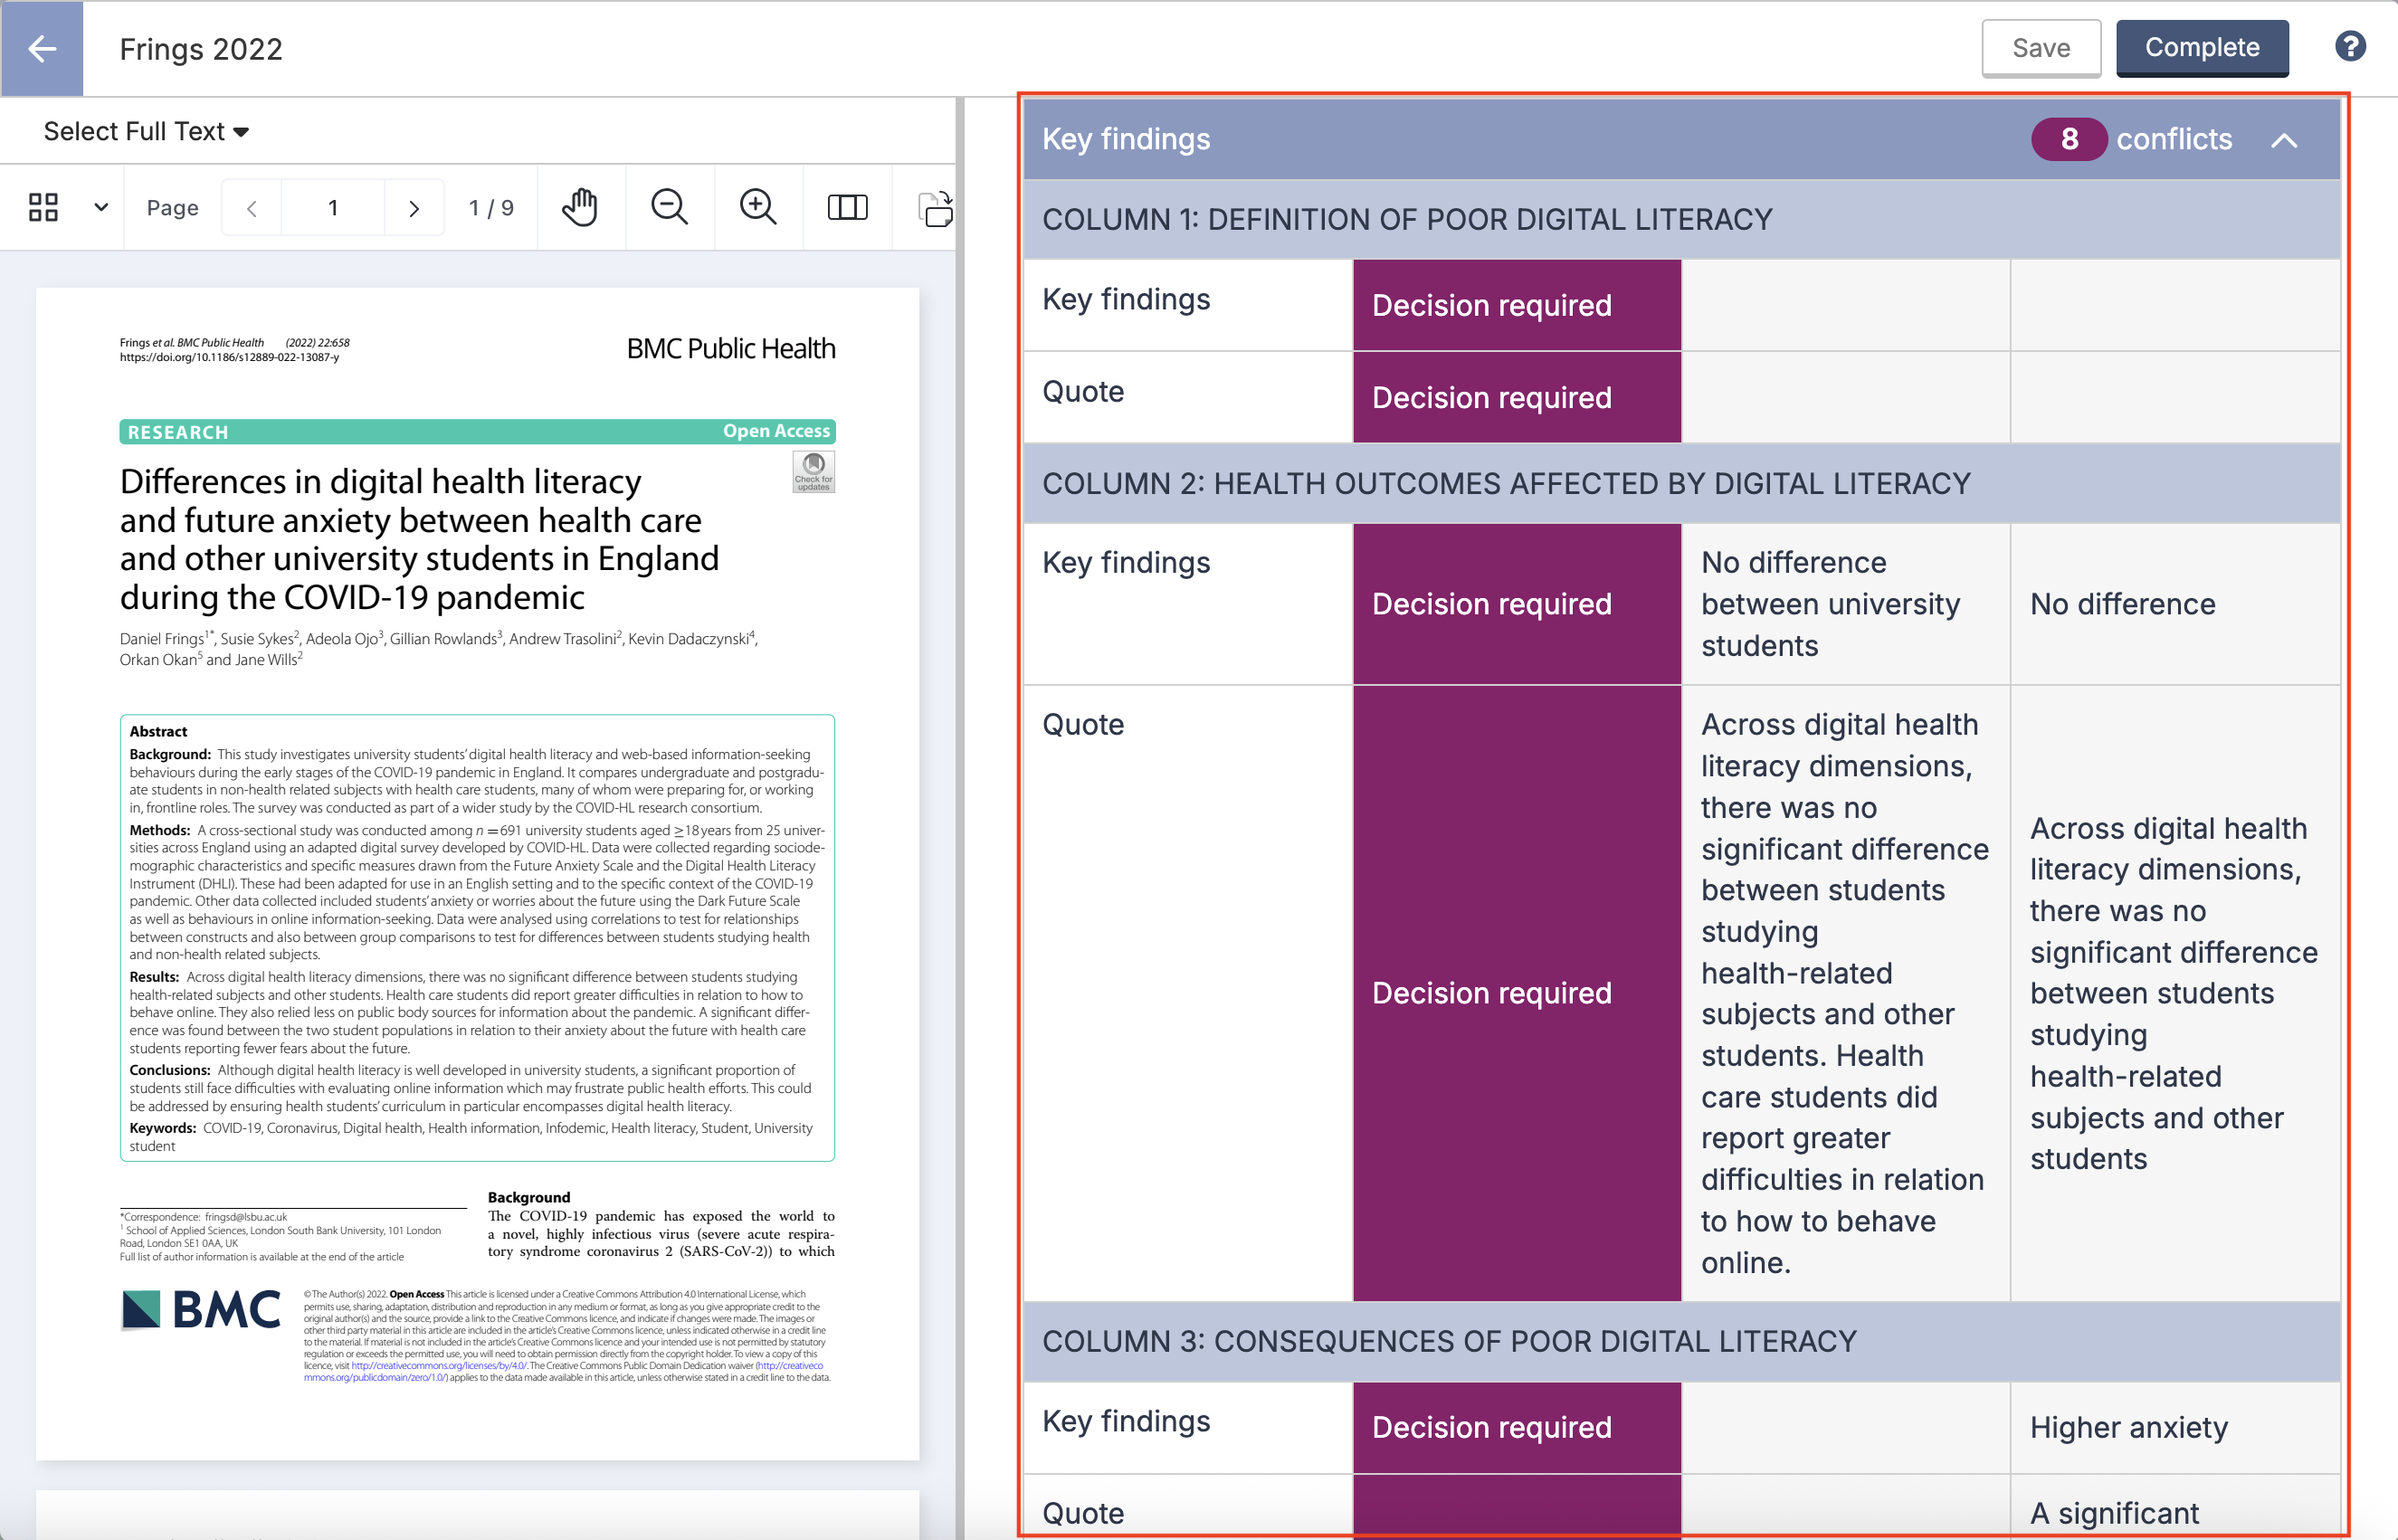
Consensus view
During consensus, the table is split up by columns to show data for Reviewer 1, Reviewer 2 and Consensus.
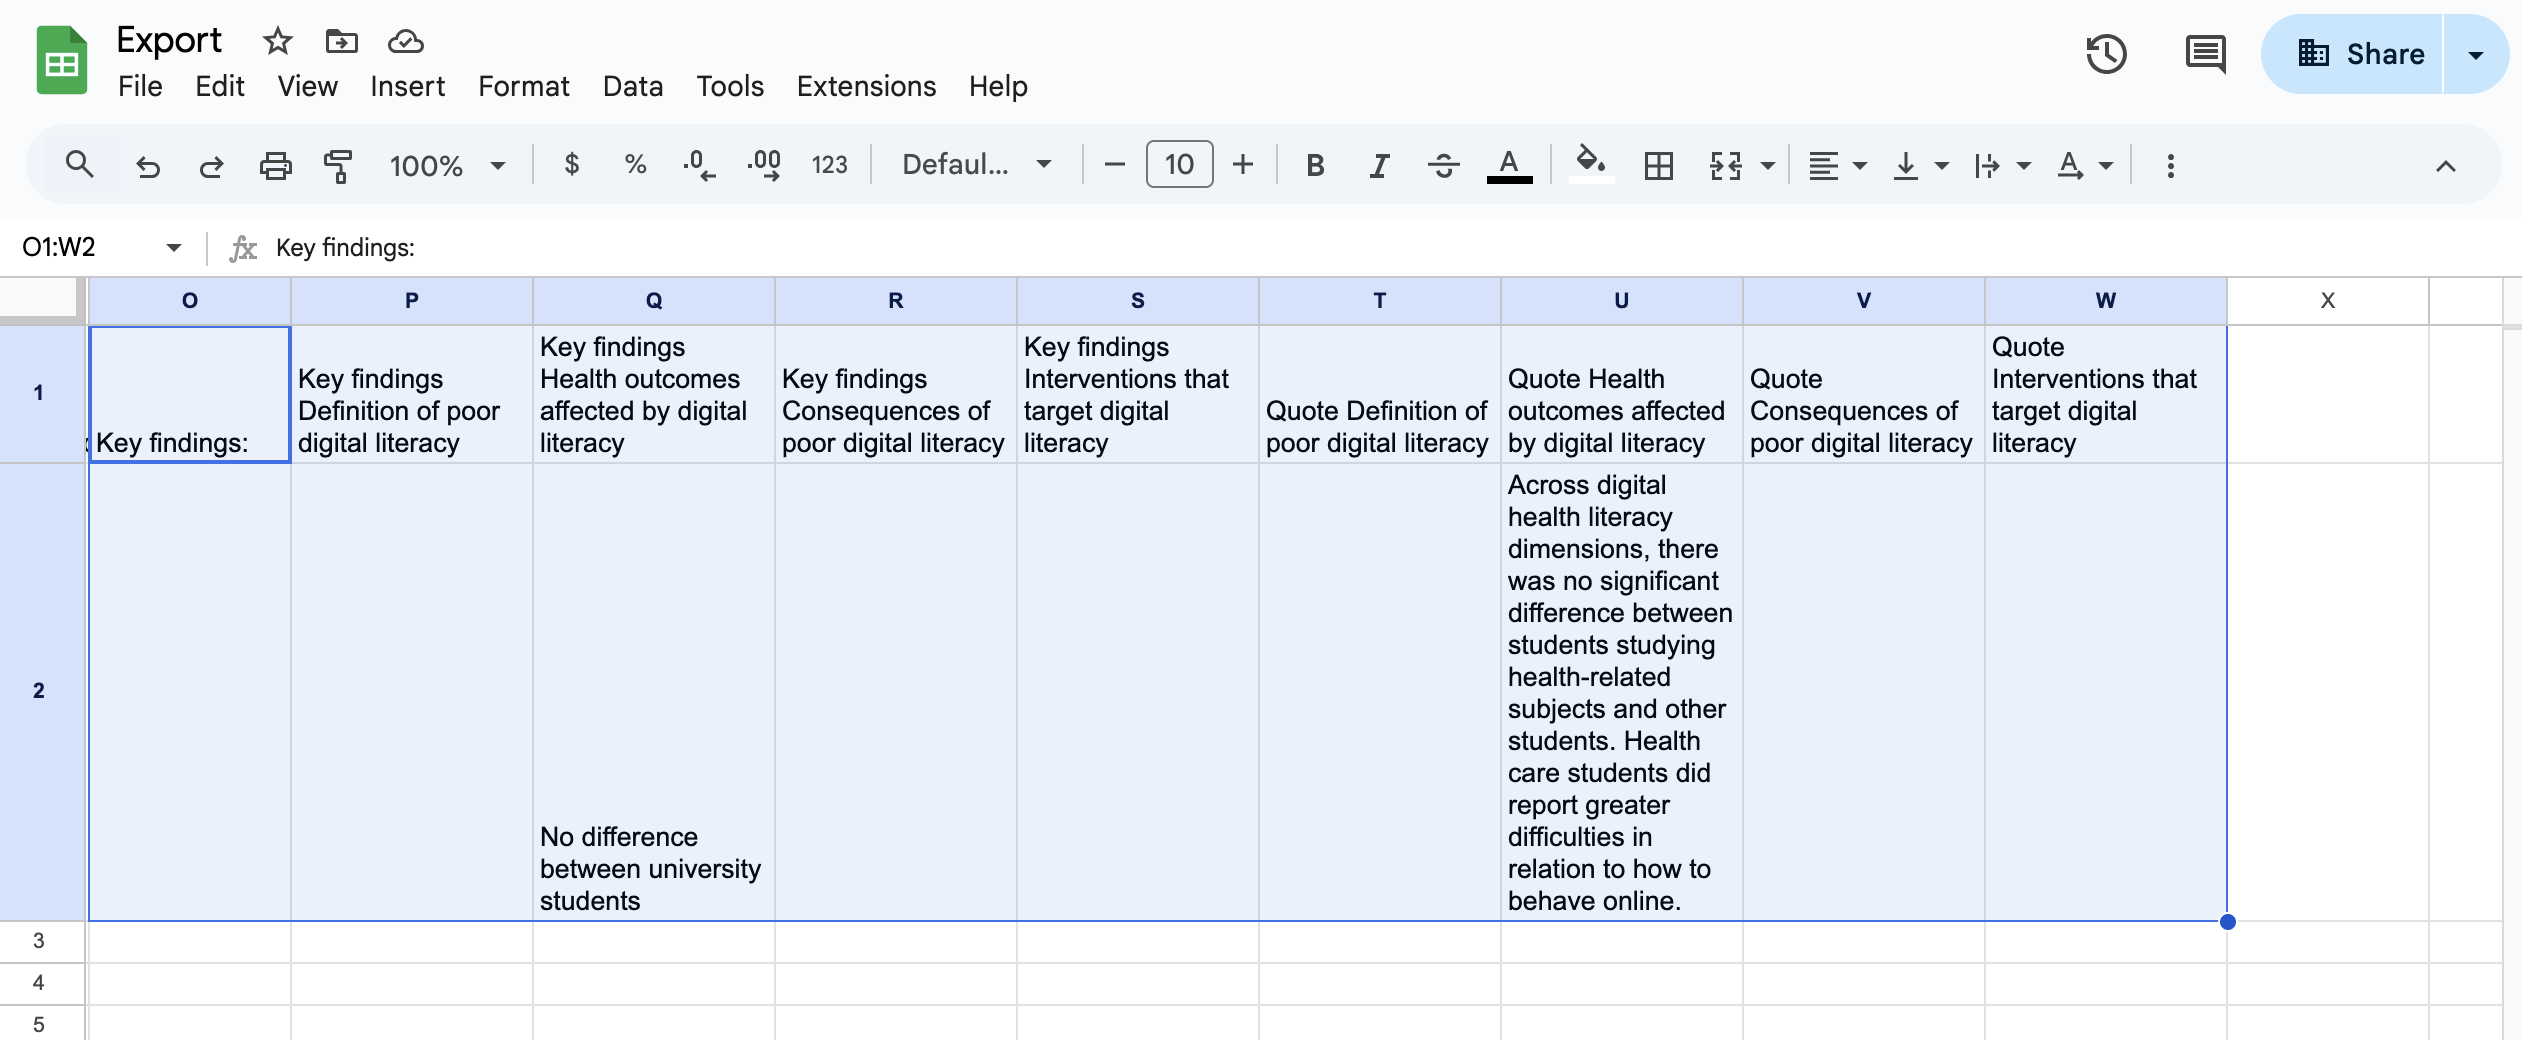
Export view
After exporting, the table is flattened to:
Table heading
Row 1, Column 1
Row 1, Column 2
Row 2, Column 1
Row 2, Column 2
etc
We recommend testing the export as part of piloting or calibrating your extraction template, especially when using tables.